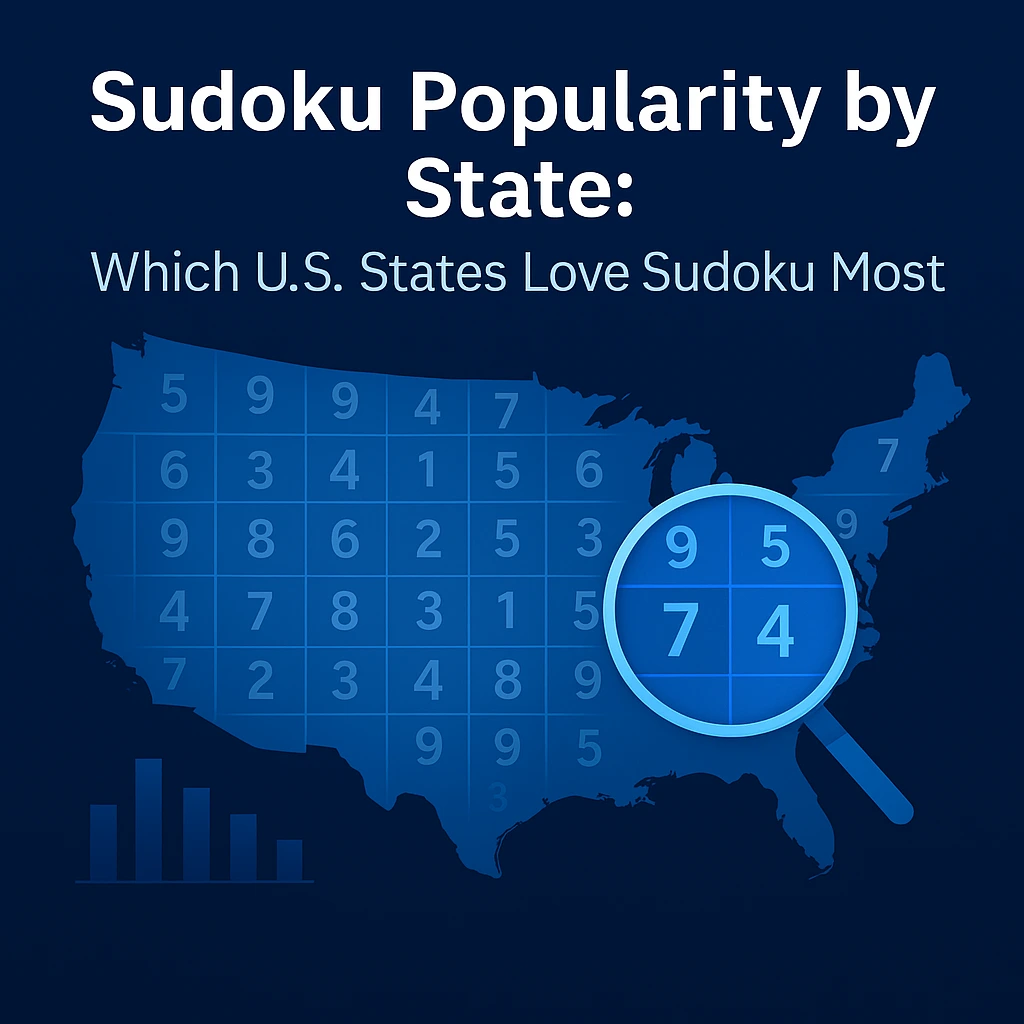
Sudoku Popularity by State: Which U.S. States Love Sudoku Most
New Hampshire is the #1 state for Sudoku popularity, with about 858 searches per 100k people, 48% above the U.S. average.
Discover which U.S. States love sudoku the most. Using State-level Google search demand (2023-2025) plus State education, income, wired internet subscriptions, libraries, climate, and work-hours data, we rank total and per-capita popularity and reveal the patterns behind America’s sudoku obsession.
Sudoku Popularity Key Findings You Can Trust
National baseline: Americans average ~580 monthly “Sudoku” searches per 100,000 people (population-weighted: 580.1).
Top states by per-capita interest (searches per 100k):
New Hampshire (858.7) · Minnesota (854.5) · Massachusetts (847.8) · Vermont (832.7) · Oregon (774.7).
Lowest per-capita interest:
Mississippi (336.4) · Alabama (350.9) · West Virginia (372.9) · Arkansas (391.8) · Louisiana (393.7).
Regional pattern (unweighted state averages): Northeast (746.4) → Midwest (655.2) → West (561.7) → South (486.7). (Population-weighted view: Northeast 707.4, Midwest 660.1, West 549.9, South 500.4.)
What best predicts Sudoku interest across states (Pearson r with per-capita searches):
College attainment +0.75; shorter work hours −0.65; more snowfall +0.59; higher income +0.57; higher internet subscription +0.52; more library visits +0.52; cooler temps −0.50; older median age +0.40; smartphone adoption ~0 (−0.04).
Model fit: A linear model using education, work hours, snowfall, temperature, income, internet, libraries, and age explains ~81.5% of state-to-state variation (R² ≈ 0.815).
Over-performers vs. model (cultural “fandom” signal): Minnesota, Iowa, New Hampshire, South Dakota, Pennsylvania. Under-performers: New Jersey, Maine, Alabama, Alaska, New Mexico.
Why This Sudoku Study
Sudoku is simple to pick up and endlessly deep. But who in the U.S. loves it most, and why, has mostly lived in anecdotes: cold-weather states “do more puzzles,” coastal metros “index high,” or “college towns drive brainy hobbies.” This analysis replaces hunches with 50-state comparative evidence.
This report is designed to be the most comprehensive, citable benchmark for U.S. Sudoku uptake at the state level for 2023–2025. It pairs Google search demand (for the exact keyword “Sudoku”) with demographics, access, culture, and climate to show both where Sudoku is hottest and what correlates with that interest.
Methodology (Transparent, Replicable)
Measure of interest. For each state, we use average monthly Google searches for “Sudoku” (2023–2025) and normalize by state population to produce searches per 100,000 residents. This per-capita normalization lets small and large states compare apples-to-apples.
Context variables. Each state’s row includes:
Population
Median age
Median household income
% with bachelor’s degree or higher
Internet subscription penetration (%)
% smartphone users
Library visits per capita
Average weekly working hours
Average yearly temperature (°F)
Average annual snowfall (inches) (Hawaii imputed to 0 for modeling)
Statistics.
Pearson correlations quantify how strongly each factor aligns with per-capita Sudoku interest.
OLS regression (with an intercept and all predictors above) summarizes combined explanatory power. Model R² ≈ 0.815; residuals identify over- and under-performing states vs. what their fundamentals would predict.
Scope & limitations.
Measures search demand, not in-app play that doesn’t require search, nor brand/synonym queries (e.g., “web sudoku,” “printable sudoku”).
State-level aggregation smooths city-level nuance.
Correlation ≠ causation. Factors like climate and education plausibly nudge behavior but do not “cause” it in isolation.
The National Picture, 2023–2025
Across the U.S., people search “Sudoku” about 580 times per month per 100,000 residents. Raw search volume naturally skews to the largest states, California (201k), Texas (135k), Florida (135k), New York (135k), but a per-capita view is the right lens for “who loves Sudoku most” rather than “who has the most people.”
To make comparisons intuitive, we also express each state as an Index vs. U.S. (U.S. = 100). For example, New Hampshire scores 148, meaning it’s 48% above the national per-capita average; Mississippi at 58 is 42% below the U.S. norm.
State Rankings: Where Sudoku Enthusiasm Runs Hottest
Top 10 states by per-capita “Sudoku” searches
-
New Hampshire — 858.7 per 100k (Index 148.0)
-
Minnesota — 854.5 (147.3)
-
Massachusetts — 847.8 (146.2)
-
Vermont — 832.7 (143.6)
-
Oregon — 774.7 (133.6)
-
Connecticut — 737.4 (127.1)
-
Rhode Island — 728.2 (125.5)
-
South Dakota — 713.8 (123.0)
-
Montana — 712.3 (122.8)
-
Illinois — 712.0 (122.7)
Bottom 10 states by per-capita “Sudoku” searches
-
New Mexico — 464.7 (80.1)
-
Nevada — 453.0 (78.1)
-
Georgia — 442.7 (76.3)
-
Oklahoma — 442.0 (76.2)
-
Texas — 431.4 (74.4)
-
Louisiana — 393.7 (67.9)
-
Arkansas — 391.8 (67.5)
-
West Virginia — 372.9 (64.3)
-
Alabama — 350.9 (60.5)
-
Mississippi — 336.4 (58.0)
Interpretation: The Northeast dominates the top ranks (NH, MA, VT, CT, RI), accompanied by Upper Midwest standouts (MN, IL, SD, MT) and Pacific Northwest (OR). The Deep South and parts of the Southwest tend to under-index.
Regional & Geographic Patterns
Unweighted state averages
(treating each state equally):
Population-weighted
(accounting for regional population size):
-
Northeast: 707.4
-
Midwest: 660.1
-
West: 549.9
-
South: 500.4
What stands out:
-
New England is an unusually dense cluster of high-index states, education, libraries, and long winters all align with at-home puzzle time.
-
The Upper Midwest (e.g., Minnesota, South Dakota) performs strongly, even above model expectations (see over-performers).
-
The South lags in per-capita interest on average; as we’ll see, a combination of longer work hours, climate, and education levels helps explain the pattern.
What Drives State-Level Sudoku Interest?
Here are the Pearson correlations (r) between per-capita “Sudoku” searches and each factor:
-
% with bachelor’s degree or higher: +0.75
States with more college graduates show the strongest alignment with Sudoku interest.
-
Average weekly working hours: −0.65
Fewer hours correlate with more puzzle time (leisure availability matters).
-
Average annual snowfall: +0.59
Snowier places index higher—consistent with more indoor time and winter hobbies.
-
Median household income: +0.57
Affluence and Sudoku interest move together (also overlaps with education).
-
Internet subscription penetration: +0.52
Access enables discovery, online play, and printable downloads.
-
Library visits per capita: +0.52
Civic learning infrastructure aligns with puzzle culture.
-
Average yearly temperature (°F): −0.50
Cooler climates ↔ more Sudoku—another “indoor hobby” signal.
-
Median age: +0.40
Older populations skew modestly higher, but it’s not a dominant driver.
-
% smartphone users: −0.04
Near-zero effect—smartphone adoption is already ubiquitous; it doesn’t explain differences between states.
Causality caution: These are associations, not proof of cause. Education, income, and internet access often travel together (multicollinearity). Still, the consistency of the education/work-hours/climate triad across states is striking.
Beyond Correlations: Over- & Under-Performance vs. Fundamentals
We fit an OLS model using all predictors jointly (education, income, internet, smartphone, libraries, work hours, temperature, snowfall, age). It explains ~81.5% of variation in state Sudoku interest (R² ≈ 0.815).
Who over-performs the model (i.e., higher Sudoku interest than predicted)?
-
Minnesota (+146.2)
-
Iowa (+115.6)
-
New Hampshire (+110.7)
-
South Dakota (+85.4)
-
Pennsylvania (+82.7)
Who under-performs the model?
-
New Jersey (−103.7)
-
Maine (−95.6)
-
Alabama (−88.2)
-
Alaska (−87.6)
-
New Mexico (−87.0)
How to read this. Over-performance suggests cultural or behavioral elements our fundamentals don’t fully capture, e.g. strong library systems, media coverage, or grassroots traditions. Under-performance suggests local counter-factors: time constraints, entertainment alternatives, or weaker puzzle culture despite favorable fundamentals.
Regional Spotlights
New England & the Northeast
New Hampshire, Massachusetts, Vermont, Connecticut, and Rhode Island all rank top-ten per capita, with New Hampshire (858.7) and Massachusetts (847.8) especially strong. The region’s education levels, library engagement, and long winters are textbook conditions for a puzzle culture that thrives. Even adjusting for these fundamentals, New Hampshire still over-delivers (+110.7), hinting at a robust local appetite for logic games beyond what the model expects.
Upper Midwest
Minnesota (854.5) is the standout—America’s most “over-performing” Sudoku state (+146.2 vs. model). South Dakota (713.8) and Iowa also punch above their weight. Taken together, this suggests a cluster of community learning habits (libraries, schools, clubs), indoor winter leisure, and perhaps higher interest in printable puzzles and brain-training content.
Pacific Northwest & the West
Oregon (774.7) ranks top-five per capita and significantly outpaces the Western average. The broader West is more mixed: states with cooler climates and higher education over-index, while warmer or fast-growth Sun Belt states tilt lower per capita (though they produce large raw volumes due to population).
The South
As a region, the South posts the lowest per-capita interest (486.7 unweighted; 500.4 weighted). Here, multiple fundamentals line up: longer working hours, milder winters (less indoor time), and lower college attainment in parts of the region. Still, it’s far from uniform—the Carolinas and parts of Virginia exceed deeper-South neighbors, and Texas (431.4) logs significant raw volume despite a low per-capita index.
Practical Implications (Researchers, Educators, Publishers)
For researchers.
-
Treat education, work hours, and winter climate as the primary explanatory cluster for state variation.
-
Consider city-level or county-level follow-ups: this model likely sharpens with metro-level education and library data.
-
Because smartphone adoption is near-universal, it explains very little about differences.
For educators & libraries.
-
High-index states (e.g., NH, MN, MA, VT, OR) are fertile ground for logic clubs, curriculum tie-ins, and community Sudoku events.
-
Lower-index states can grow interest with beginner pathways (how-tos, community workshops) and printable packs—especially effective where internet access is improving but not yet saturated.
For puzzle publishers & brands.
-
Targeting: The Northeast and Upper Midwest offer strong per-capita returns; time winter campaigns in cold states.
-
Product mix: Advanced strategy content and expert-level puzzles for high-education markets; approachable “learn Sudoku” series for emerging markets.
-
Channel choice: Where library visits per capita are high, emphasize educational framing, classroom tie-ins, and printable formats.
FAQs
Appendix A — Full 50-State Table (Per-Capita Rank)
Appendix A. Which U.S. States Love Sudoku Most (2023–2025, population-weighted index = 100).
Appendix B — Correlation Matrix (rounded)
Appendix C — Model Summary (Plain English)
What we modeled
Outcome (dependent variable): Per-capita Sudoku interest = monthly Google searches for the exact term “Sudoku” per 100,000 residents by state (2023–2025).
Sample: 50 U.S. states (District of Columbia excluded).
Approach: Ordinary Least Squares (linear regression) with an intercept and nine predictors: Median age, Median household income, % with bachelor’s degree, Internet subscription %, % smartphone users, Library visits per capita, Average weekly work hours, Average yearly temperature (°F), Average annual snowfall (inches).
Fit (how well the model explains state-to-state differences)
R² ≈ 0.815 — ~82% of the variation in Sudoku interest across states is explained by these nine factors together.
How to read directions of effect
• Positive coefficient (e.g., more education, more snowfall) → states tend to show higher Sudoku interest.
• Negative coefficient (e.g., more work hours, warmer temperatures) → states tend to show lower Sudoku interest.
Exact coefficients available on request.
Where states beat or lag the model (residuals)
A residual is the difference between a state’s actual Sudoku interest and what the model predicts given its fundamentals. Positive = over-performs; negative = under-performs.
Over-performers: Minnesota (+146.2), Iowa (+115.6), New Hampshire (+110.7), South Dakota (+85.4), Pennsylvania (+82.7).
Under-performers: New Jersey (−103.7), Maine (−95.6), Alabama (−88.2), Alaska (−87.6), New Mexico (−87.0).
What this means
• Together, education, time available (shorter work hours), and climate (colder, snowier) explain most of the map.
• When a state over-performs, think local culture and institutions that promote puzzles (libraries, schools, clubs, media).
• When a state under-performs, think competing leisure options, time constraints, or weaker puzzle traditions.
Method (plain text version)
We regressed each state’s Searches per 100k on the nine predictors above with an intercept. Predictors were used in their natural units (no logarithms). Hawaii’s snowfall was treated as 0 for modeling. We used R² for overall fit and emphasize signs of effects and residuals rather than a full coefficient table.
Limitations
This measures search demand, not app usage without search. The analysis is observational (associations, not causation). Some predictors (e.g., education and income) are correlated, so don’t over-interpret any single factor in isolation.
Sudoku Popularity Conclusion
From New Hampshire and Minnesota at the top, to Mississippi and Alabama at the bottom, America’s Sudoku map is both predictable and surprising. Predictable because education, work hours, and climate—the trio most people would guess—really do align with interest. Surprising because even after we control for those fundamentals, some states defy expectations: Minnesota, Iowa, New Hampshire, South Dakota, Pennsylvania show a Sudoku culture that over-performs.
For researchers, this dataset offers a robust baseline and a roadmap for deeper city-level studies. For educators and libraries, it spotlights where Sudoku-based programming can scale and where introductory materials can grow the audience. For publishers and brands, it points to when and where to market (winter, cold-weather regions) and what to promote (advanced content for high-education states; learn-to-play for emerging markets).
This page is intended as the leading reference on U.S. state-level Sudoku interest for 2023–2025. If you cite it, please reference the update date and coverage window. If you’re building on this work—e.g., by layering in metro-level data, app telemetry, or school/library programming records—consider sharing your findings; together we can map America’s logic-game culture with even greater fidelity.
Sources & References (APA)
Provenance key (metric → source in this article)
Population → U.S. Census Bureau, Vintage 2024 state population estimates (accessed via StatsAmerica state list).
Monthly searches → Google search volume data, July 2023 – June 2025.
Per-capita (per 100k) & Index vs. U.S. → Calculated by Sudoku4Adults.com from population and search volume.
Median age → U.S. Census Bureau (ACS), compiled by StatsAmerica “Median Age in 2024.”
Median income → U.S. Census Bureau, ACS 2023 1-year, table S1901 (Median household income in the past 12 months, 2023 dollars).
Bachelor’s % → U.S. Census Bureau, ACS 2023 1-year, table S1501 (Educational Attainment).
Internet % (broadband households) → U.S. Census Bureau, ACS 2023, S2801 (Types of Computers and Internet Subscriptions).
Smartphone % → U.S. Census Bureau, ACS 2023, S2801 (Types of Computers and Internet Subscriptions).
Library visits → IMLS Public Libraries Survey via NCES Digest Table 701.60.
Work hours → BLS CES: “All employees, total private — annual average 2024.”
Avg temperature → NOAA statewide averages (1971–2000).
Snowfall → Current Results: “Average snowfall by state.”
Sources & References (APA)
Related Posts
